Vibecoding 032 — Bangalore's weather, your way
Table of Contents
Bangalore weather has been a good shorthand for things that were much desired in the past and are enshittified messes now.
What if one looked back at the numbers from the past and compared them with now, instead of going on vague notions of how things actually were? Numbers probably don’t lie. But let’s not delude ourselves by cherry-picking the best and the worst. What other interesting insights can I glean from them?
Open sesame: mrdee.in/weather
Where the numbers come from #
Karthik S runs weather.karthiks.co. Every morning his R script pulls hourly weather data for Bangalore back to 1981. It draws one chart for the year so far and asks Claude Haiku for three lines of commentary. It is a good chart. But it is one chart, and I kept wanting to ask it other questions. How has this monsoon gone? Was last Tuesday unusual? Is this October like 2005?
His repo is MIT-licensed, and the daily run also publishes a small CSV. It has one row per day with the high, the low and the rain. That file is enough to answer all of those questions in the browser.
What you can change #
The window. The last 7, 14, 30, 45 or 90 days. The year to date. The southwest monsoon (June to September) or the northeast one (October to December). Or any range up to three years.
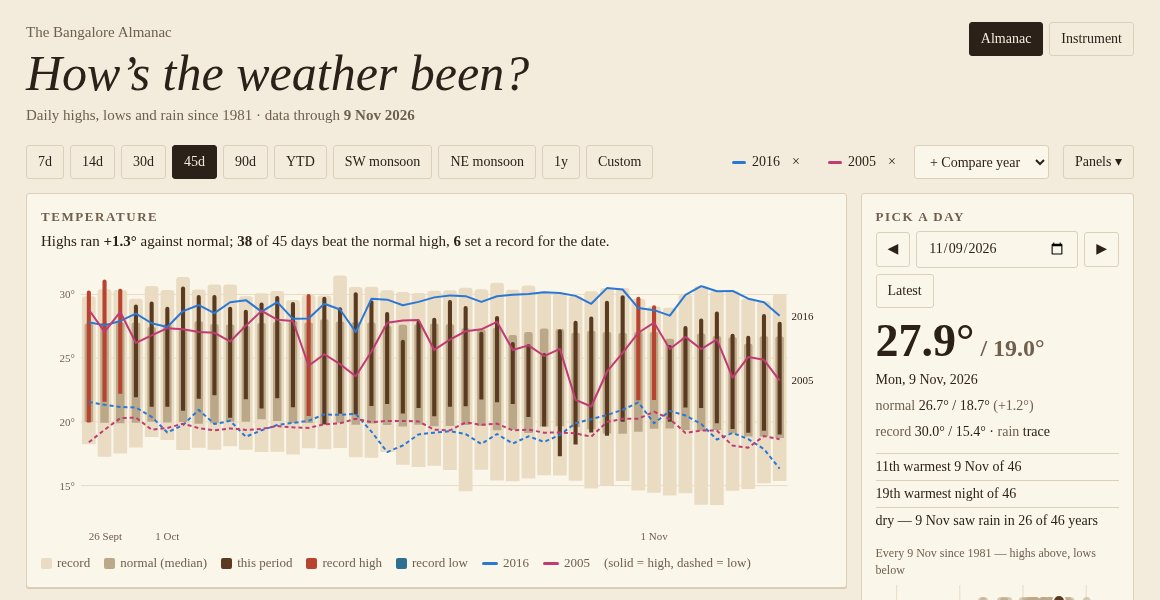
A single day. Pick a date and you get its high, low and rain. You also get its rank among the same date in every year. On 9 November the high was 27.9°. That made it the 11th warmest 9 November of 46. A row of dots shows every year’s value, with this year’s marked.
The panels. Temperature, daily rain, cumulative rain, the gap from normal, and a set of counts and streaks. Hide any of them and put the rest in any order.
Years to compare. Add up to three past years. They show up as lines on the temperature and cumulative rain charts.
Everything you choose goes into the address bar. A link brings back the same view.
What the charts mean #
I kept Karthik’s definitions so the page agrees with his chart. “Normal” is the median high or low for that calendar date across all the years. “Record” is the highest high or lowest low for that date in any other year. A bar that pokes past the record band turns red.
The last 45 days to 9 November make the point. Highs ran 1.3° above normal. Thirty-eight of the 45 days beat the normal high. Six set a record for their date.
Two looks #
I mocked up two designs from the same data. One looks like a printed almanac: cream paper, serif type, ink-brown bars. The other looks like a weather station readout: dark, monospaced, amber bars. I asked which one to build, and the answer was both. So there’s a switch in the corner. It starts on the one that matches your phone’s light or dark setting and remembers your choice.
The comparison years needed three line colours that people with colour blindness can tell apart in both looks. I checked candidates with a colour-contrast script instead of trusting my eye. My first pick for the dark look failed. Pink and teal look different to most people. Under red-green colour blindness they were almost the same colour. Blue, magenta and olive passed in both looks.
Things that went wrong #
The browser wasn’t allowed to read the file. Karthik’s server doesn’t send a CORS header. That header is how a server tells browsers that pages on other sites may read its files. Without it, a page on mrdee.in can’t fetch the CSV, even though anyone can download it. The fix is a tiny Cloudflare function on my site. It fetches the file on the server, where that rule doesn’t apply, and hands it to the page. It keeps a copy for three hours, so Karthik’s server sees only a few requests a day however many people visit. If his server is down, the page gets the last good copy.
The copy on GitHub had gone stale. GitHub does send the CORS header, so its copy of the CSV looked like an easy way out. But that copy stopped updating on 14 October. The live site was current to yesterday. I used the live site.
29 February was ranked against 57 years. I’d grouped 29 February with 28 February so leap years wouldn’t leave gaps in the normals. That was fine for the normals. But the day card then ranked a leap day against every 28 February too. It now compares a leap day only with the other ten.
“0.1 mm” next to “dry”. 9 November had 0.05 mm of rain. One decimal place rounds that to 0.1, which counts as a rainy day. Then the rank line called the day dry. Anything under 0.1 mm now shows as “trace”.
What I took away #
The data was the easy part. Karthik had already done the hard work of fetching, cleaning and publishing 45 years of it. My part was the questions he hadn’t built a chart for, and a short fix for a header his server doesn’t send.
Data: Oikolab, via Karthik S (MIT) · Live: mrdee.in/weather
Part of the 100 Vibe Coding Projects series.